According to the paper, "The results actually showed that during the last approximately 250 years -- since the period known as the Little Ice Age -- a clear correlation can be seen where the external forces, i.e. the Sun's energy cycle and the impact of volcanic eruptions, are accompanied by a corresponding temperature fluctuation with a time lag of about five years."
"Although the temperature fluctuations are small -- less than 1°C -- there is a general consensus among climate researchers that the AMO phenomenon has had a major impact on the climate in the area around the North Atlantic for thousands of years, but until now there has been doubt about what could cause this slow rhythm in the temperature of the Atlantic Ocean."
"This phenomenon is called the Atlantic Multidecadal Oscillation (AMO), which consists of relatively warm periods lasting thirty to forty years being replaced by cool periods of the same duration. The researchers were able to read small systematic variations in the water temperature in the North Atlantic in measurements taken by ships during the last 140 years."
"Although the temperature fluctuations are small -- less than 1°C -- there is a general consensus among climate researchers that the AMO phenomenon has had a major impact on the climate in the area around the North Atlantic for thousands of years, but until now there has been doubt about what could cause this slow rhythm in the temperature of the Atlantic Ocean."
"Another model explains the AMO as being driven by fluctuations in the amount of solar energy received by the Earth, and as being affected by small changes in the energy radiated by the Sun itself and the after-effects of volcanic eruptions. Both these factors are also known as 'external forces' that have an impact on the Earth's radiation balance."
"However, there has been considerable scepticism towards the idea that a phenomenon such as an AMO could be driven by external forces at all -- a scepticism that the Aarhus researchers now demonstrate as unfounded"
"However, there has been considerable scepticism towards the idea that a phenomenon such as an AMO could be driven by external forces at all -- a scepticism that the Aarhus researchers now demonstrate as unfounded"
"It should also be pointed out that these fluctuations occur on the basis of evenly increasing ocean temperatures during the last approximately fifty years -- an increase connected with global warming,"
"During the last century, the AMO has had a strong bearing on significant weather phenomena such as hurricane frequency and droughts -- with considerable economic and human consequences. A better understanding of this phenomenon is therefore an important step for efforts to deal with and mitigate the impact of climate variations,"
"The results provide a new and very important perspective on the AMO phenomenon because they are based on data and not computer models, which are inherently incomplete. The problem is that the models do not completely describe all the physical correlations and feedbacks in the system, partly because these are not fully understood. And when the models are thus unable to reproduce the actual AMO signal, it is hard to know whether they have captured the essence of the AMO phenomenon."
"An interesting new theory among solar researchers and meteorologists is that the Sun can control climate variations via the very large variations in UV radiation, which are partly seen in connection with changes in sunspot activity during the Sun's eleven-year cycle. UV radiation heats the stratosphere in particular via increased production of ozone, which can have an impact on wind systems and thereby indirectly on the global ocean currents as well,"
Temperature fluctuations: Atlantic Ocean dances with the sun and volcanoes
March 31, 2014
Source: Aarhus University
Summary:
Natural fluctuations in the ocean temperature in the North Atlantic have a significant impact on the climate in the northern hemisphere. These fluctuations are the result of a complex dance between the forces of nature, but researchers can now show that solar activity and the impact of volcanic eruptions have led this dance during the last two centuries.
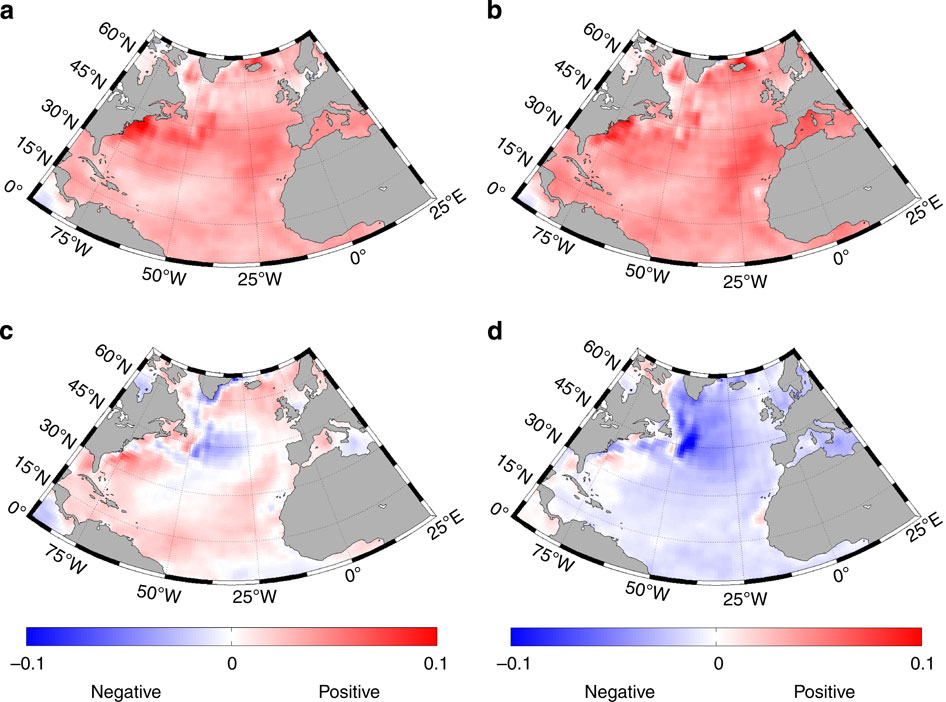
Ocean temperature has been regularly measured since 1870, which makes it possible to calculate a mean temperature at each point for the period for the period 1870 to the present day. Ocean temperature varies throughout the year and there are significant variations due to weather systems and over longer timescales. These illustrations show how the average temperatures over 20-year intervals have varied between cold (blue) and warm (red) periods. This variation is called the Atlantic Multidecadal Oscillation, abbreviated to AMO.
Imagine a ballroom in which two dancers apparently keep in time to their own individual rhythm. The two partners suddenly find themselves moving to the same rhythm and, after a closer look, it is clear to see which one is leading.
It was an image like this that researchers at Aarhus University were able to see when they compared studies of solar energy release and volcanic activity during the last 450 years, with reconstructions of ocean temperature fluctuations during the same period.
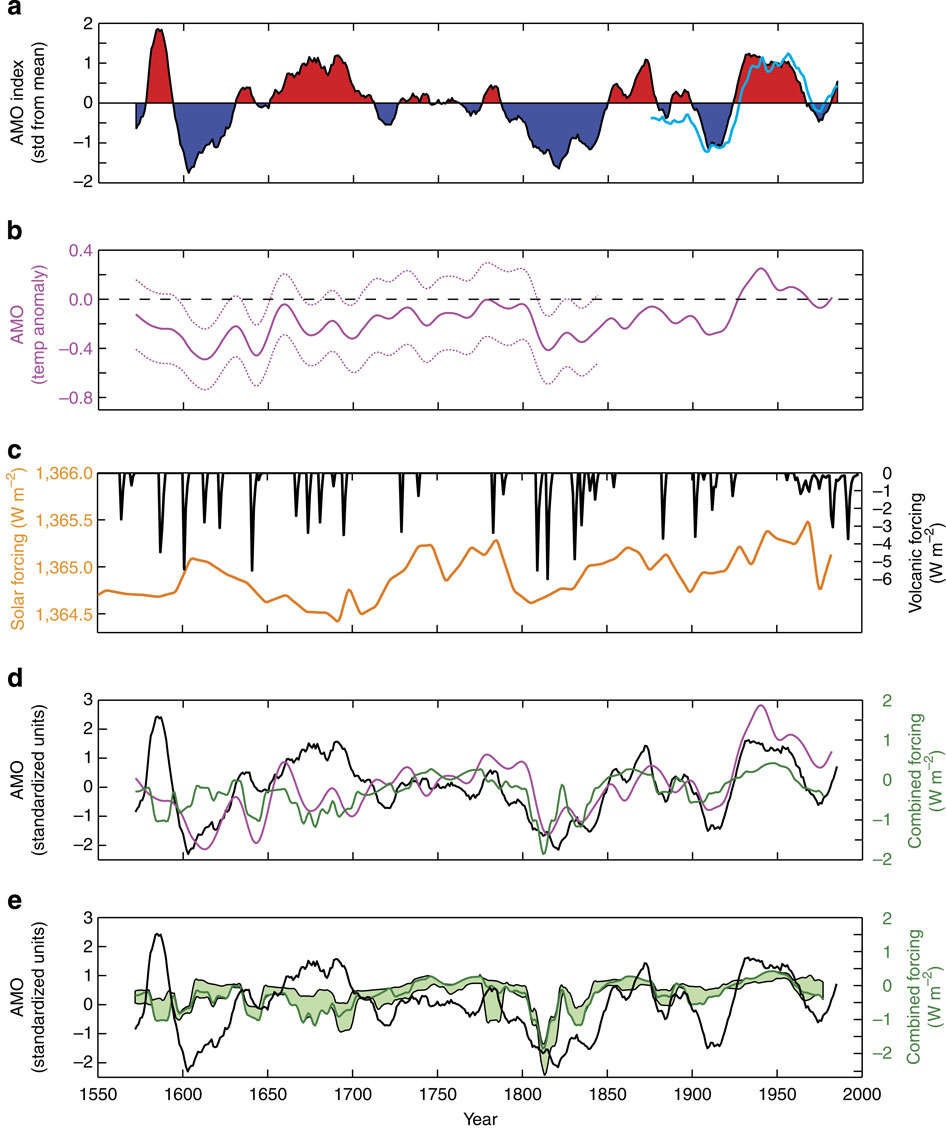
The results actually showed that during the last approximately 250 years -- since the period known as the Little Ice Age -- a clear correlation can be seen where the external forces, i.e. the Sun's energy cycle and the impact of volcanic eruptions, are accompanied by a corresponding temperature fluctuation with a time lag of about five years.
In the previous two centuries, i.e. during the Little Ice Age, the link was not as strong, and the temperature of the Atlantic Ocean appears to have followed its own rhythm to a greater extent.
The results were recently published in the scientific journal Nature Communications.
In addition to filling in yet another piece of the puzzle associated with understanding the complex interaction of the natural forces that control the climate, the Danish researchers paved the way for linking the two competing interpretations of the origin of the oscillation phenomenon.
Temperature fluctuations discovered around the turn of the millennium
The climate is defined on the basis of data including mean temperature values recorded over a period of thirty years. Northern Europe thus has a warm and humid climate compared with other regions on the same latitudes. This is due to the North Atlantic Drift (often referred to as the Gulf Stream), an ocean current that transports relatively warm water from the south-west part of the North Atlantic to the sea off the coast of Northern Europe.
Around the turn of the millennium, however, climate researchers became aware that the average temperature of the Atlantic Ocean was not entirely stable, but actually fluctuated at the same rate throughout the North Atlantic. This phenomenon is called the Atlantic Multidecadal Oscillation (AMO), which consists of relatively warm periods lasting thirty to forty years being replaced by cool periods of the same duration. The researchers were able to read small systematic variations in the water temperature in the North Atlantic in measurements taken by ships during the last 140 years.
Although the temperature fluctuations are small -- less than 1°C -- there is a general consensus among climate researchers that the AMO phenomenon has had a major impact on the climate in the area around the North Atlantic for thousands of years, but until now there has been doubt about what could cause this slow rhythm in the temperature of the Atlantic Ocean. One model explains the phenomenon as internal variability in the ocean circulation -- somewhat like a bathtub sloshing water around in its own rhythm. Another model explains the AMO as being driven by fluctuations in the amount of solar energy received by the Earth, and as being affected by small changes in the energy radiated by the Sun itself and the after-effects of volcanic eruptions. Both these factors are also known as 'external forces' that have an impact on the Earth's radiation balance.
However, there has been considerable scepticism towards the idea that a phenomenon such as an AMO could be driven by external forces at all -- a scepticism that the Aarhus researchers now demonstrate as unfounded
"Our new investigations clearly show that, since the Little Ice Age, there has been a correlation between the known external forces and the temperature fluctuations in the ocean that help control our climate. At the same time, however, the results also show that this can't be the only driving force behind the AMO, and the explanation must therefore be found in a complex interaction between a number of mechanisms. It should also be pointed out that these fluctuations occur on the basis of evenly increasing ocean temperatures during the last approximately fifty years -- an increase connected with global warming," says Associate Professor Mads Faurschou Knudsen, Department of Geoscience, Aarhus University, who is the main author of the article.
Convincing data from the Earth's own archives
Researchers have attempted to make computer simulations of the phenomenon ever since the discovery of the AMO, partly to enable a better understanding of the underlying mechanism. However, it is difficult for the computer models to reproduce the actual AMO signal that can be read in the temperature data from the last 140 years.
Associate Professor Knudsen and his colleagues instead combined all available data from the Earth's own archives, i.e. previous studies of items such as radioactive isotopes and volcanic ash in ice cores. This provides information about solar energy release and volcanic activity during the last 450 years, and the researchers compared the data with reconstructions of the AMO's temperature rhythm during the same period.
"We've only got direct measurements of the Atlantic Ocean temperature for the last 140 years, where it was measured by ships. But how do you measure the water temperature further back in time? Studies of growth rings in trees from the entire North Atlantic region come into the picture here, where 'good' and 'bad' growth conditions are calibrated to the actual measurements, and the growth rings from trees along the coasts further back in time can therefore act as reserve thermometers," explains Associate Professor Knudsen.
The results provide a new and very important perspective on the AMO phenomenon because they are based on data and not computer models, which are inherently incomplete. The problem is that the models do not completely describe all the physical correlations and feedbacks in the system, partly because these are not fully understood. And when the models are thus unable to reproduce the actual AMO signal, it is hard to know whether they have captured the essence of the AMO phenomenon.
Impact of the sun and volcanoes
An attempt to simply explain how external forces such as the Sun and volcanoes can control the climate could sound like this: a stronger Sun heats up the ocean, while the ash from volcanic eruptions shields the Sun and cools down the ocean. However, it is hardly as simple as that.
"Fluctuations in ocean temperature have a time lag of about five years in relation to the peaks we can read in the external forces. However, the direct effect of major volcanic eruptions is clearly seen as early as the same year in the mean global atmospheric temperature, i.e. a much shorter delay. The effect we studied is more complex, and it takes time for this effect to spread to the ocean currents," explains Associate Professor Knudsen.
"An interesting new theory among solar researchers and meteorologists is that the Sun can control climate variations via the very large variations in UV radiation, which are partly seen in connection with changes in sunspot activity during the Sun's eleven-year cycle. UV radiation heats the stratosphere in particular via increased production of ozone, which can have an impact on wind systems and thereby indirectly on the global ocean currents as well," says Associate Professor Knudsen. However, he emphasises that researchers have not yet completely understood how a development in the stratosphere can affect the ocean currents on Earth.
Towards a better understanding of the climate
"In our previous study of the climate in the North Atlantic region during the last 8,000 years, we were able to show that the temperature of the Atlantic Ocean was presumably not controlled by the Sun's activity. Here the temperature fluctuated in its own rhythm for long intervals, with warm and cold periods lasting 25-35 years. The prevailing pattern was that this climate fluctuation in the ocean was approximately 30-40% faster than the fluctuation we'd previously observed in solar activity, which lasted about ninety years. What we can now see is that the Atlantic Ocean would like to -- or possibly even prefer to -- dance alone. However, under certain circumstances, the external forces interrupt the ocean's own rhythm and take over the lead, which has been the case during the last 250 years," says Associate Professor Bo Holm Jacobsen, Department of Geoscience, Aarhus University, who is the co-author of the article.
"It'll be interesting to see how long the Atlantic Ocean allows itself to be led in this dance. The scientific challenge partly lies in understanding the overall conditions under which the AMO phenomenon is sensitive to fluctuations in solar activity and volcanic eruptions," he continues.
"During the last century, the AMO has had a strong bearing on significant weather phenomena such as hurricane frequency and droughts -- with considerable economic and human consequences. A better understanding of this phenomenon is therefore an important step for efforts to deal with and mitigate the impact of climate variations," Associate Professor Knudsen concludes.
Story Source:
The above story is based on materials provided by Aarhus University. The original article was written by Christina Troelsen. Note: Materials may be edited for content and length.
Journal Reference:
Mads Faurschou Knudsen, Bo Holm Jacobsen, Marit-Solveig Seidenkrantz, Jesper Olsen. Evidence for external forcing of the Atlantic Multidecadal Oscillation since termination of the Little Ice Age. Nature Communications, 2014; 5 DOI:10.1038/ncomms4323
Imagine a ballroom in which two dancers apparently keep in time to their own individual rhythm. The two partners suddenly find themselves moving to the same rhythm and, after a closer look, it is clear to see which one is leading.
It was an image like this that researchers at Aarhus University were able to see when they compared studies of solar energy release and volcanic activity during the last 450 years, with reconstructions of ocean temperature fluctuations during the same period.
The results actually showed that during the last approximately 250 years -- since the period known as the Little Ice Age -- a clear correlation can be seen where the external forces, i.e. the Sun's energy cycle and the impact of volcanic eruptions, are accompanied by a corresponding temperature fluctuation with a time lag of about five years.
In the previous two centuries, i.e. during the Little Ice Age, the link was not as strong, and the temperature of the Atlantic Ocean appears to have followed its own rhythm to a greater extent.
The results were recently published in the scientific journal Nature Communications.
In addition to filling in yet another piece of the puzzle associated with understanding the complex interaction of the natural forces that control the climate, the Danish researchers paved the way for linking the two competing interpretations of the origin of the oscillation phenomenon.
Temperature fluctuations discovered around the turn of the millennium
The climate is defined on the basis of data including mean temperature values recorded over a period of thirty years. Northern Europe thus has a warm and humid climate compared with other regions on the same latitudes. This is due to the North Atlantic Drift (often referred to as the Gulf Stream), an ocean current that transports relatively warm water from the south-west part of the North Atlantic to the sea off the coast of Northern Europe.
Around the turn of the millennium, however, climate researchers became aware that the average temperature of the Atlantic Ocean was not entirely stable, but actually fluctuated at the same rate throughout the North Atlantic. This phenomenon is called the Atlantic Multidecadal Oscillation (AMO), which consists of relatively warm periods lasting thirty to forty years being replaced by cool periods of the same duration. The researchers were able to read small systematic variations in the water temperature in the North Atlantic in measurements taken by ships during the last 140 years.
Although the temperature fluctuations are small -- less than 1°C -- there is a general consensus among climate researchers that the AMO phenomenon has had a major impact on the climate in the area around the North Atlantic for thousands of years, but until now there has been doubt about what could cause this slow rhythm in the temperature of the Atlantic Ocean. One model explains the phenomenon as internal variability in the ocean circulation -- somewhat like a bathtub sloshing water around in its own rhythm. Another model explains the AMO as being driven by fluctuations in the amount of solar energy received by the Earth, and as being affected by small changes in the energy radiated by the Sun itself and the after-effects of volcanic eruptions. Both these factors are also known as 'external forces' that have an impact on the Earth's radiation balance.
However, there has been considerable scepticism towards the idea that a phenomenon such as an AMO could be driven by external forces at all -- a scepticism that the Aarhus researchers now demonstrate as unfounded
"Our new investigations clearly show that, since the Little Ice Age, there has been a correlation between the known external forces and the temperature fluctuations in the ocean that help control our climate. At the same time, however, the results also show that this can't be the only driving force behind the AMO, and the explanation must therefore be found in a complex interaction between a number of mechanisms. It should also be pointed out that these fluctuations occur on the basis of evenly increasing ocean temperatures during the last approximately fifty years -- an increase connected with global warming," says Associate Professor Mads Faurschou Knudsen, Department of Geoscience, Aarhus University, who is the main author of the article.
Convincing data from the Earth's own archives
Researchers have attempted to make computer simulations of the phenomenon ever since the discovery of the AMO, partly to enable a better understanding of the underlying mechanism. However, it is difficult for the computer models to reproduce the actual AMO signal that can be read in the temperature data from the last 140 years.
Associate Professor Knudsen and his colleagues instead combined all available data from the Earth's own archives, i.e. previous studies of items such as radioactive isotopes and volcanic ash in ice cores. This provides information about solar energy release and volcanic activity during the last 450 years, and the researchers compared the data with reconstructions of the AMO's temperature rhythm during the same period.
"We've only got direct measurements of the Atlantic Ocean temperature for the last 140 years, where it was measured by ships. But how do you measure the water temperature further back in time? Studies of growth rings in trees from the entire North Atlantic region come into the picture here, where 'good' and 'bad' growth conditions are calibrated to the actual measurements, and the growth rings from trees along the coasts further back in time can therefore act as reserve thermometers," explains Associate Professor Knudsen.
The results provide a new and very important perspective on the AMO phenomenon because they are based on data and not computer models, which are inherently incomplete. The problem is that the models do not completely describe all the physical correlations and feedbacks in the system, partly because these are not fully understood. And when the models are thus unable to reproduce the actual AMO signal, it is hard to know whether they have captured the essence of the AMO phenomenon.
Impact of the sun and volcanoes
An attempt to simply explain how external forces such as the Sun and volcanoes can control the climate could sound like this: a stronger Sun heats up the ocean, while the ash from volcanic eruptions shields the Sun and cools down the ocean. However, it is hardly as simple as that.
"Fluctuations in ocean temperature have a time lag of about five years in relation to the peaks we can read in the external forces. However, the direct effect of major volcanic eruptions is clearly seen as early as the same year in the mean global atmospheric temperature, i.e. a much shorter delay. The effect we studied is more complex, and it takes time for this effect to spread to the ocean currents," explains Associate Professor Knudsen.
"An interesting new theory among solar researchers and meteorologists is that the Sun can control climate variations via the very large variations in UV radiation, which are partly seen in connection with changes in sunspot activity during the Sun's eleven-year cycle. UV radiation heats the stratosphere in particular via increased production of ozone, which can have an impact on wind systems and thereby indirectly on the global ocean currents as well," says Associate Professor Knudsen. However, he emphasises that researchers have not yet completely understood how a development in the stratosphere can affect the ocean currents on Earth.
Towards a better understanding of the climate
"In our previous study of the climate in the North Atlantic region during the last 8,000 years, we were able to show that the temperature of the Atlantic Ocean was presumably not controlled by the Sun's activity. Here the temperature fluctuated in its own rhythm for long intervals, with warm and cold periods lasting 25-35 years. The prevailing pattern was that this climate fluctuation in the ocean was approximately 30-40% faster than the fluctuation we'd previously observed in solar activity, which lasted about ninety years. What we can now see is that the Atlantic Ocean would like to -- or possibly even prefer to -- dance alone. However, under certain circumstances, the external forces interrupt the ocean's own rhythm and take over the lead, which has been the case during the last 250 years," says Associate Professor Bo Holm Jacobsen, Department of Geoscience, Aarhus University, who is the co-author of the article.
"It'll be interesting to see how long the Atlantic Ocean allows itself to be led in this dance. The scientific challenge partly lies in understanding the overall conditions under which the AMO phenomenon is sensitive to fluctuations in solar activity and volcanic eruptions," he continues.
"During the last century, the AMO has had a strong bearing on significant weather phenomena such as hurricane frequency and droughts -- with considerable economic and human consequences. A better understanding of this phenomenon is therefore an important step for efforts to deal with and mitigate the impact of climate variations," Associate Professor Knudsen concludes.
Story Source:
The above story is based on materials provided by Aarhus University. The original article was written by Christina Troelsen. Note: Materials may be edited for content and length.
Journal Reference:
Mads Faurschou Knudsen, Bo Holm Jacobsen, Marit-Solveig Seidenkrantz, Jesper Olsen. Evidence for external forcing of the Atlantic Multidecadal Oscillation since termination of the Little Ice Age. Nature Communications, 2014; 5 DOI:10.1038/ncomms4323
Evidence for external forcing of the Atlantic Multidecadal Oscillation since termination of the Little Ice Age
- Nature Communications
- 5,
- Article number:
- 3323
- doi:10.1038/ncomms4323
- Received
- Accepted
- Published


 0.01;
0.01; 

